Skip to content
POKoIT SOLUTIONS

POKOMONITOR · SELF-HOSTED MONITORING

See which site needs attention before a fault disrupts operations.

PokoMonitor brings device health, site status, infrastructure metrics, services, and custom checks into one view. It is built for retail and distributed organisations, and works equally well at a single site when clear, self-hosted monitoring is required.

PokoMonitor home dashboard showing sites that need attention
The home dashboard highlights exceptions while healthy infrastructure stays visually quiet.
Self-hostedYour data stays with you
Windows + Linuxx64 and Linux ARM64 agents
Offline licenceSigned local validation
SMTP + webhookFlexible notifications

MONITORING FOR REAL OPERATIONS

A signal is not enough. You need the context of the site, device, and business impact.

In a distributed organisation, a fault rarely remains a purely technical event. An unavailable POS terminal slows sales, an unreachable network path interrupts data exchange, and a stopped service can halt an important local process. When those signals live in separate tools, the team loses time establishing where the problem is and how urgent it is.

PokoMonitor groups devices by site and optional region, rolls each site status up from its device estate, and surfaces what needs action. IT teams get the detail required for diagnosis, while operations users can follow a shared overview without entering administration screens.

A DEFINING POKOMONITOR ADVANTAGE

Every site on one map, with status that immediately shows where action is needed.

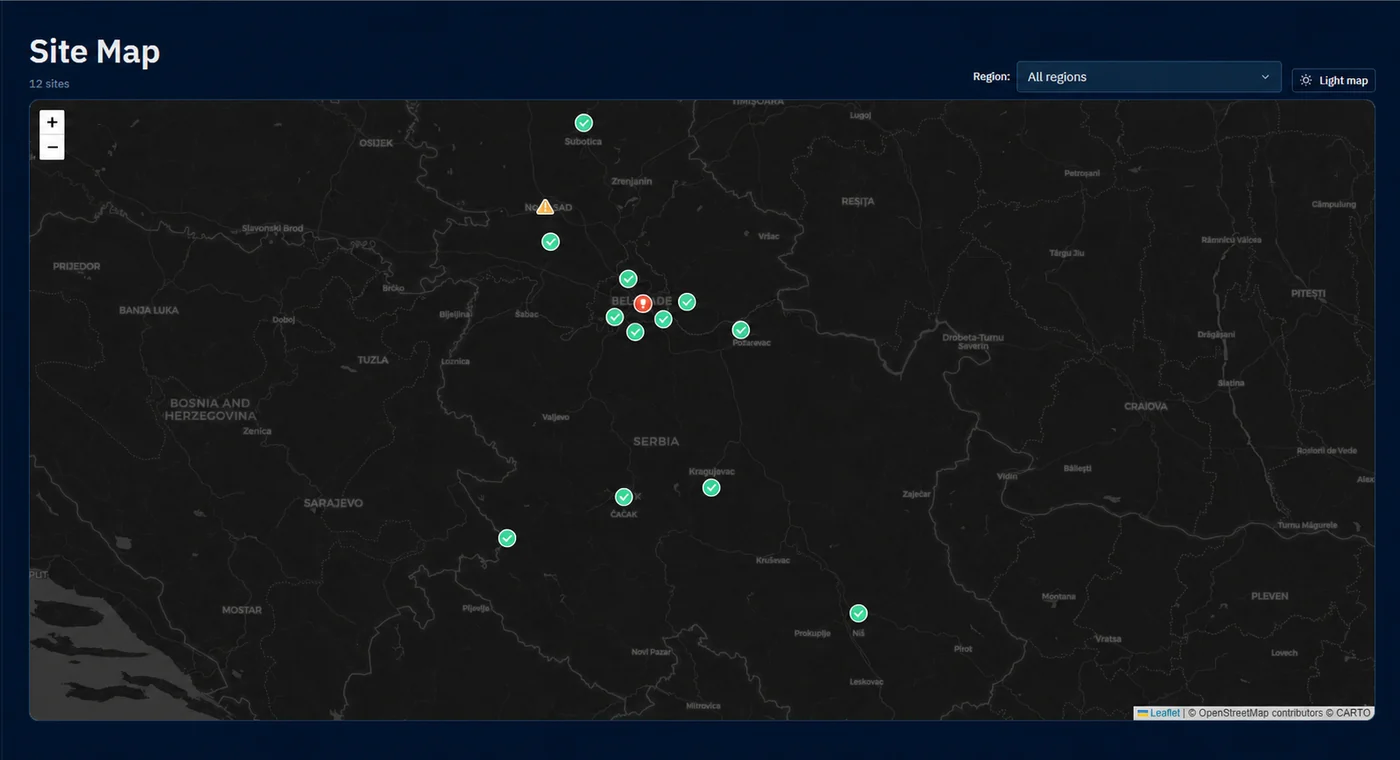
Site Map turns a long device list into a clear geographic view of operations. Healthy sites remain quiet, while warning, critical, or stale status immediately identifies the location that needs investigation. The team can filter by region, open a specific site, and continue down to the device or check that changed its status.

PokoMonitor Site Map with all locations and status markers
Site Map shows every location, a regional filter, and status markers that distinguish healthy, warning, and critical states.
01Status in geographic context

See immediately which city, region, or site has a problem.

02Rapidly narrow the view

Regional filtering helps each responsible team focus on the sites that matter to them.

03A direct path to the cause

Move from a marker to the site, its devices, alerts, and the specific failed checks.

A TOUR THROUGH THE PRODUCT

From the overall picture to the device behind the problem.

The map provides geographic context, while the other views guide the team through priority, site, device, check, and alert.

01

Start with what needs attention

The home dashboard presents the overall health verdict, device and site totals, active alerts, and a concrete list of exceptions. Instead of searching through tables, the team immediately sees the site, device, and reason behind the changed status.
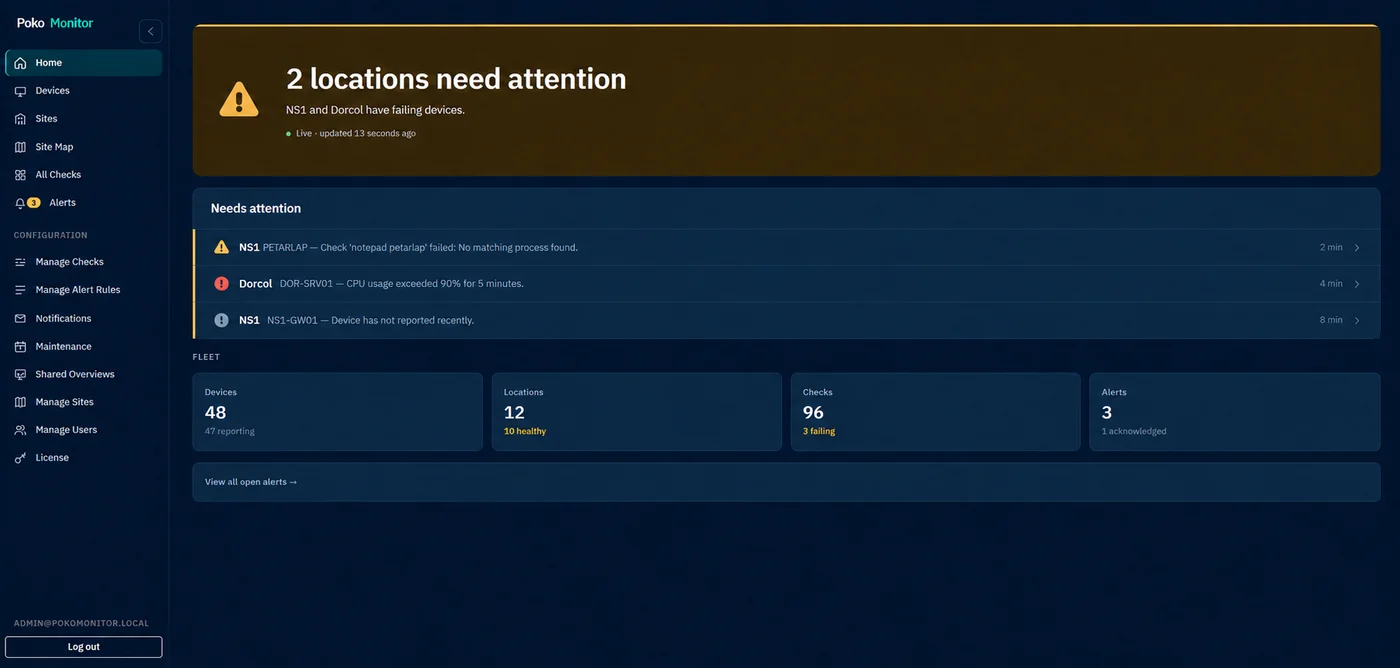
PokoMonitor operational home overview
Status by exception directs attention to the few events that matter.
02

Compare sites and find the exception

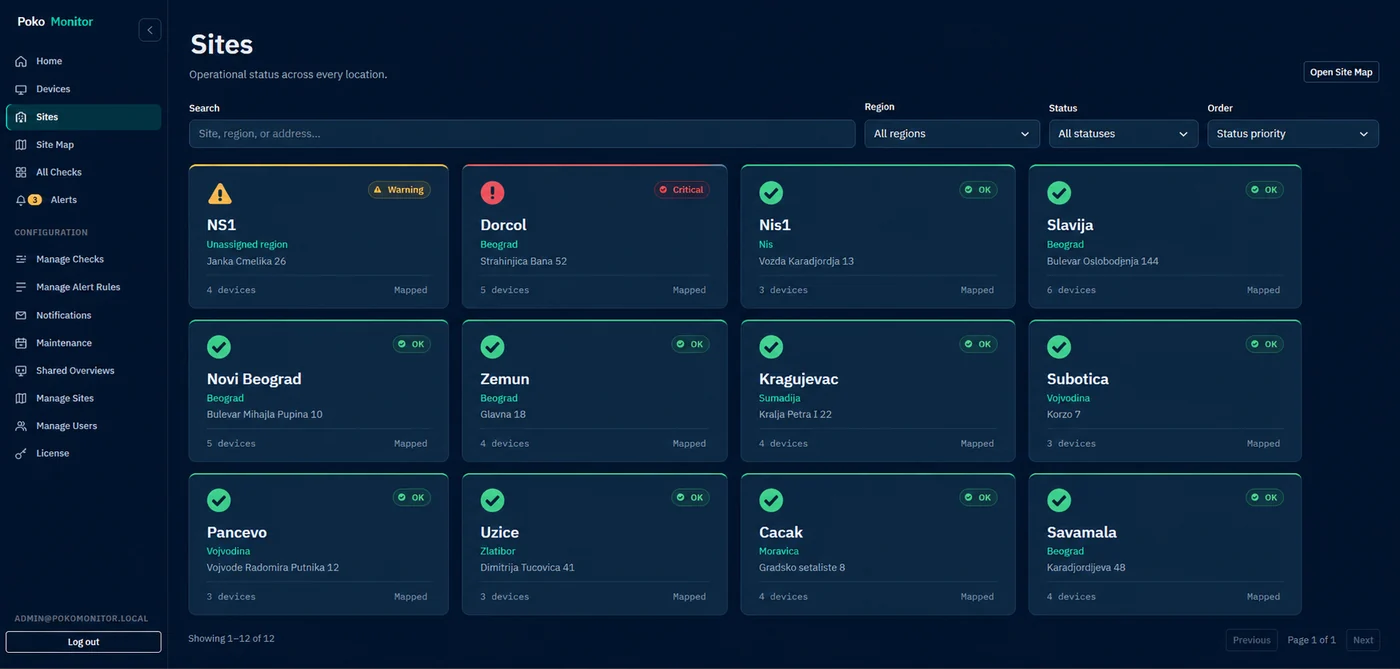
Site cards show rolled-up status, region, address, and device count. Search, filters, and priority sorting let the team keep healthy locations in the background and open the site with a critical, warning, or stale signal first.

PokoMonitor site view grouped by status
Sites can be sorted by status, region, and operational priority.
03

From alert to technical cause

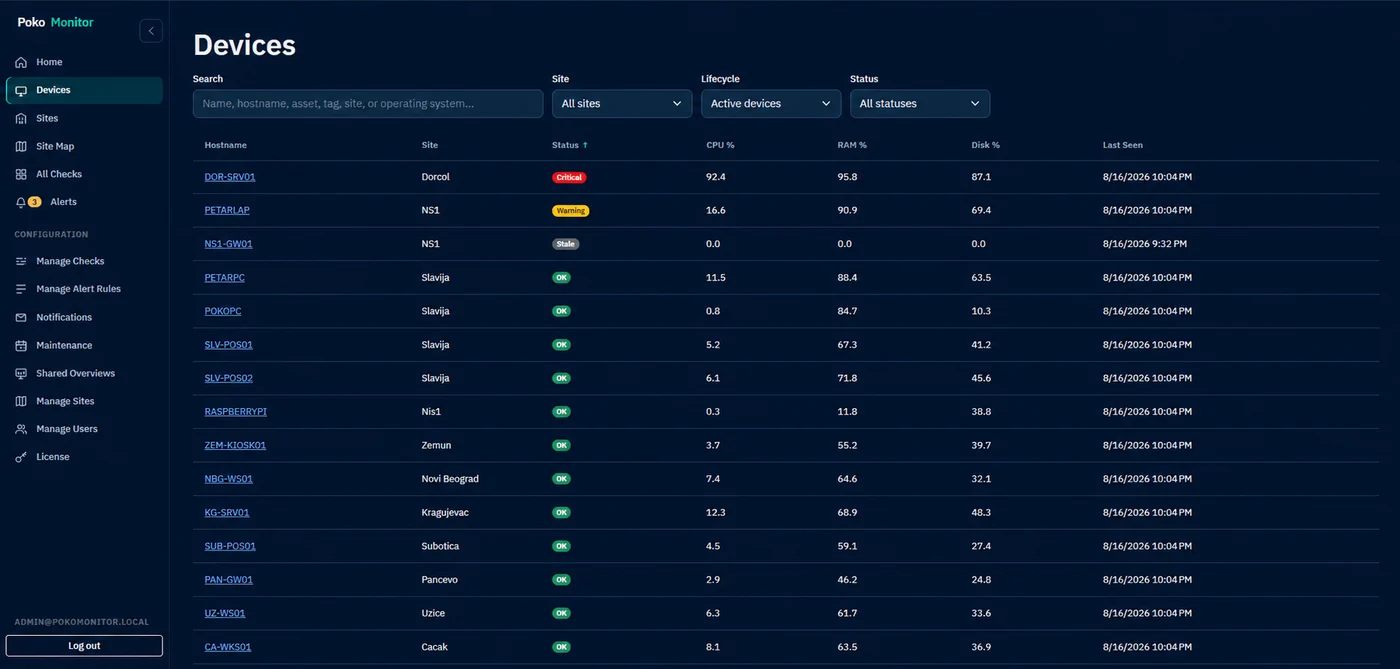
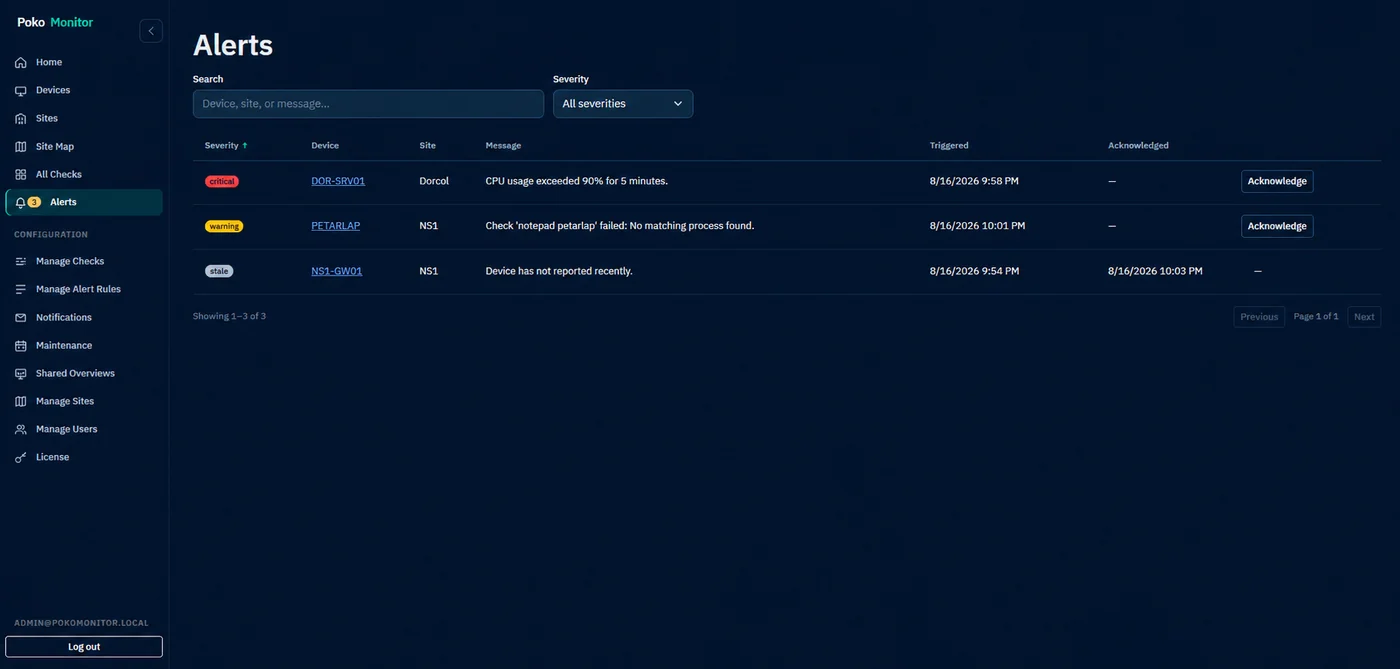
The device view connects hostname, site, last report, and current CPU, RAM, and disk values. Alerts retain severity, trigger time, message, and acknowledgement state. The team can distinguish an active fault, a transient spike, a stale device, and an event already owned by a colleague.

PokoMonitor device list with resource status
One list for devices, sites, resources, and last report time.
PokoMonitor alert list
Alerts remain searchable, measurable, and acknowledgeable.

WHAT YOU CAN MONITOR

From core resources to checks that follow your way of working.

Checks can apply globally, to one site, or to a specific device. Each has its own interval, severity, consecutive-failure threshold, and expected result.

01

Resources and availability

CPU, RAM, disk, network throughput, uptime, and last report time across current and historical views.

02

Processes and services

Check a named process, Windows service, or Linux systemd unit on the device.

03

Network and endpoints

Ping, TCP ports, HTTP URLs, Linux mount points, and Windows UNC or SMB paths.

04

Custom checks

Run a local script or executable and verify its expected exit code.

ALERTING WITHOUT UNNECESSARY NOISE

Notify the right people and silence what is planned.

Rules for resources, unavailable devices, and failed checks can require sustained duration or multiple consecutive failures before raising an alert.

Email and generic webhook

Notifications are delivered through your SMTP server or a JSON webhook. Rules can use different channels and optional recovery messages.

Planned maintenance

Schedule maintenance for a site, device, or individual check, or temporarily silence a rule without losing history.

Acknowledgement and recovery

Open alerts can be acknowledged, searched, and filtered. Recovery is recorded so each event has a clear beginning and end.

HOW IT WORKS

Control stays in your environment.

The server, PostgreSQL database, web interface, and agents run in your infrastructure. Monitoring does not depend on a POKO ITS cloud service, and the signed licence is validated locally. Users connect over the internal network or your VPN, in line with your organisation security architecture.

01AgentsWindows x64 · Linux x64 / ARM64
02PokoMonitor ServerWindows or Linux · x64 / ARM64
03Web view and alertsSMTP · Generic webhook

FROM INSTALLATION TO OPERATIONAL VIEW

A controlled rollout with short-lived tokens and individual device credentials.

  1. 01

    Prepare the server

    PokoMonitor is deployed in the agreed server environment as a Windows service or Linux systemd service, with its database, HTTPS access, and backup plan.

  2. 02

    Model the sites

    Regions, sites, addresses, time zones, and device roles are defined.

  3. 03

    Enrol devices

    The agent is installed as a Windows Service or Linux systemd service and receives its own durable credential.

  4. 04

    Rules and checks

    Thresholds, services, processes, network paths, URLs, and notification channels are configured.

  5. 05

    Test and handover

    The team validates failure scenarios, maintenance, recovery, dashboards, and operational ownership.

DEMO AND LICENSING

Try the full product in your environment.

The planned demo currently covers up to 15 active devices for 30 days, with a built-in grace period. The device count and final terms are confirmed for each request because the demo policy may change.

Demo support includes a product walkthrough, installation and implementation help, and best-practice guidance.

There is currently no public download of the demo version.
We first review the environment and agree a safe delivery method.
ACTIVE-DEVICE LICENSING

Same features. Terms matched to the environment.

  • Demo and production use the same feature set.
  • The licence is validated locally and does not require a constant internet connection.
  • A 30-day grace period applies after licence expiry.
Send an enquiry

NO-OBLIGATION CONVERSATION

Is PokoMonitor a fit for your environment?

Describe the objective and current state. We will explain what is worth checking and what a realistic first step could look like.

Contact POKO ITS